NOTE: We strongly recommend that you read the following topics before attempting to construct a menu for menu engineering purposes.
•How can I make Menu Engineering work for me?
•How do I interpret a menu engineering graph?
The Engineering (Graph) page of the Menu Form consists of two main sections. They are the graph section (at the top) and the menu engineering table section (at the bottom). See the following image.
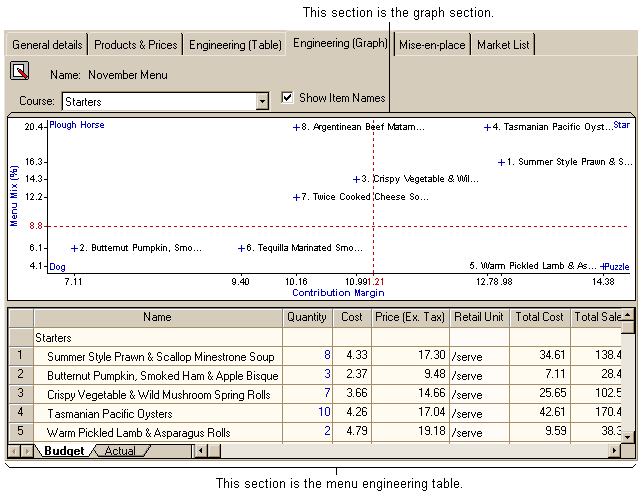
The Graph
The information that appears in the graph section is determined by the data you have entered into the budget and actual quantities in the Engineering (Table) page, or into the table at the bottom of this page. This is a graphic representation of a sub-menu (ie. Starters, Main Course, Dessert etc.) within the current menu. It displays the relative sales performance of each item in the sub-menu and assigns them a menu engineering ranking such as Star, Puzzle, Plough Horse or Dog in an easy to view format. You can move from the budgeted performance to the actual performance by selecting the relevant tab in the menu engineering table. You can also select the sub-menu you wish to view, by clicking on the drop list as shown in the image below.
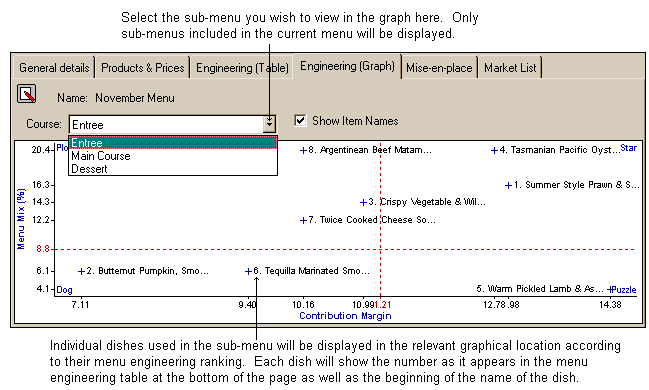
Clicking the 'Show item names' checkbox toggles on/off the names of the items in the graph. Sometimes you will have a number of items clustered around the same point on the graph and it will be difficult to make out the individual item names due to the clutter. By turning off the names display, the program only draws the item numbers on the graph and makes it a bit easier to read.
The Menu Engineering Table
The menu engineering table displays the same information as the Engineering (Table) page but for a single sub-menu at a time. It is possible to view details for the budget figures and actual figures in this section. The sub-menu you view will be displayed in a graph form in the graph section. You can alter both actual and budgeted quantities for each sub-menu from this table. See the following image.
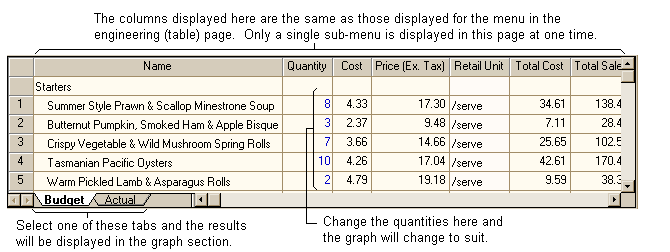
See the Engineering (Table) page topic for a full description of the fields shown in this grid.